Make Every Week, Part 3: How crowded is the Washington, D.C. DMV?
First off, an apology: In the aftermath of the July 4th holiday, I took the week off last week. So you’ll see a double #MakeEveryWeek feature coming up soon.
Everyone hates the Department of Motor Vehicles. Over the years, it has somehow become the universal American symbol for a soul-breaking bureaucracy. Washington, D.C.’s division does its best, but you still end up wondering why it takes to long to get your license renewed.
My wife recently stopped by the DMV in Georgetown. While looking up the office hours for her, I remembered that D.C. does something neat: It streams live webcam footage from the DMV waiting room, so you can get a sense for how crowded your branch is before you go.
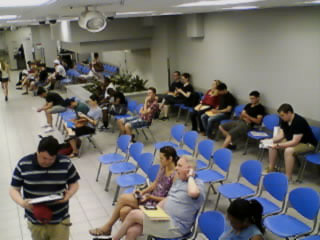
It also publishes a calculated wait time, but I’ve never found that particularly accurate. These images are simple JPEGS, very easy to download and parse. So I started thinking: Is there a way to use this footage to detect the ebbs and flows of crowds at the DMV — and avoid the rush yourself?
A poor man’s computer vision
I don’t have a lot experience with computer vision, though it’s definitely something I’d like to explore further. But the DMV did me a favor: They bought those bright blue chairs.
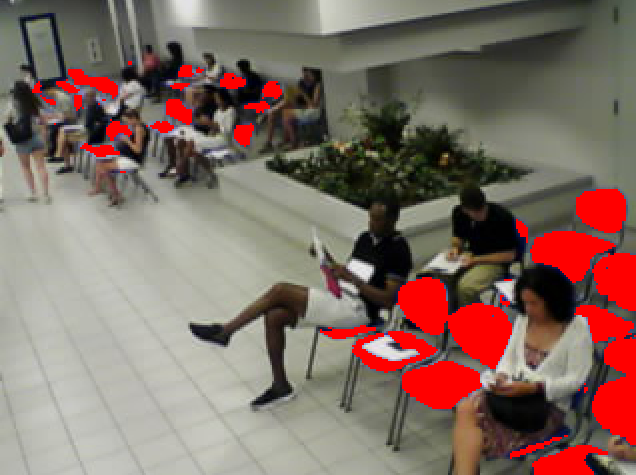
Turns out that blue is pretty distinctive. With the exception of the security guard’s uniform, there’s nothing else in the DMV colored quite like it. Counting those blue pixels was key: The more bright blue in the picture, the relatively fewer people waiting in line. If I scraped these pictures every minute or so and ran my script for a few weeks, I could analyze the colors and aggregate my data to make a cool time-series graph.
Here’s a picture where the matching blue is colored red. Searching for this narrow band of color avoids people (and that newspaper) pretty well.
But there’s a few things I’d have to figure out:
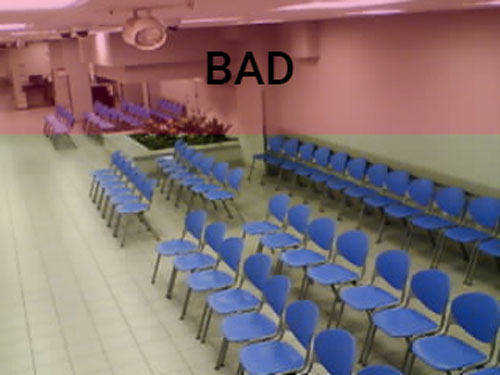
- There are three camera angles (well, four, but the last one’s just a shot of the door.) The first two are wide shots, and the last one is a bit narrower and shows fewer chairs. I’d have to calibrate my pixel-counting to compensate.
- The first two shots actually overlap. One camera shoots down the main waiting room, and the other shoots the opposite angle. It’s hard to tell, because one has been flipped horizontally. But I’d have to remove the overlap so people aren’t double-counted.
- Lastly, all the cameras show the room at an angle, so chairs in the back will have fewer blue pixels than chairs in the front. I’d have to compensate for this or risk under-counting the crowd if a few big chairs went unfilled in the front.
On to the code
I wrote this in Node and used a bunch of libraries, but primarily LWIP, an image processing library.
First, I set up an array containing the camera URLs, the vertical position where to start scanning the image, a weight to account for skew and the rough number of empty seats pictured in the photo.
var cameras = [
  {
    url: "https://ftp.dmv.washingtondc.gov/w/gt1/video.jpg",
    start: 90,
    rate_of_change: .976,
    empty_seats: 38
  },
  {
    url: "https://ftp.dmv.washingtondc.gov/w/gt2/video.jpg",
    start: 100,
    rate_of_change: .969,
    empty_seats: 9
  },
  {
    url: "https://ftp.dmv.washingtondc.gov/w/gt4/video.jpg",
    start: 0,
    rate_of_change: .983,
    empty_seats: 24
  }
];
Note that for the first two images, I start processing about 90-100 pixels down. That’s to remove the chairs that are in the foreground of the other camera angle.
That rate_of_change basically applies less weight to pixels in the foreground than pixels in the background, as each pixel proportionally represents more chair the higher up in the image you go.
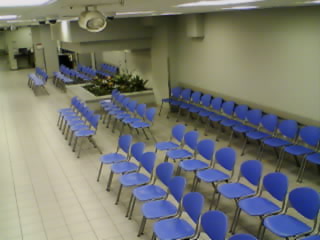
Before I do anything with the live images, I want to find out how much blue is in each picture when the room is empty. (I’ve saved copies of footage from when the office is closed. They leave the lights on all night…)
// First, let's calculate the baseline amount of blue for each camera
async.eachOfSeries(cameras, function(camera, i, callback){

  // I've saved the photos of the empty DMV room, so let's open those
  fs.readFile("control_images/" + i + ".jpg", function(err, data){
    if(err) throw err;
    var body = new Buffer(data, 'binary');
    lwip.open(body, 'jpeg', function(err, image){
      if( err ) throw err;

      // Set the total amount of blue detected to zero
      camera.controlBlue = 0;
      for(y = camera.start; y <= 239; y++){
        for( x = 0; x <= 319; x++){
          var hsv = getHSV(image);
          var pixelScore = y - camera.start * camera.rate_of_change;
          camera.controlBlue += (hsv.h >=220 && hsv.h <= 240 && hsv.s > 30 && hsv.v > 30) ? pixelScore : 0;
        }
      }
      callback();
    });
  });
}, function(){
  console.log("Done setting baseline...");
});

function getHSV(image){
  return Color().rgb([image.getPixel(x,y).r, image.getPixel(x,y).g, image.getPixel(x,y).b]).hsv();
}
I’m using the awesome aysnc library to keep track of all my callbacks. I cycle through the images, open them a binary file and then parse them row by row and pixel by pixel, testing if they match the blue I’m looking for and applying the various weights outlined in the cameras object.
Another shoutout to the Color library, which allows you to easily convert RGB values to HSV (hue, saturation, value/brightness). The blue I’m looking for is in a relatively narrow hue band, is medium saturation and medium-to-high brightness.
After I get the baseline values sorted out, I repeat the same operation with the live images, comparing their blue scores to the empty images to guesstimate how many people are sitting in the chairs.
// Cycle through each of the cameras
async.eachOfSeries(cameras, function(camera, i, callback){

  request({url: camera.url, encoding: 'binary'}, function(err, res, body){
    var body = new Buffer(body, 'binary');

    lwip.open(body, 'jpeg', function(err, image){
			if(err) throw err;

      // Like above, set the total amount of blue detected to zero
			var blue = 0;
			for(y = camera.start; y <= 239; y++){
				for( x = 0; x <= 319; x++){
				  hsv = getHSV(image);
          pixelScore = y - camera.start * camera.rate_of_change;
					blue += (hsv.h >=220 && hsv.h <= 240 && hsv.s > 30 && hsv.v > 30) ? pixelScore : 0;
				}
			}
      camera.percentBlue = blue / camera.controlBlue;
			totalEmptySeats += camera.percentBlue * camera.empty_seats;
			console.log("Camera " + (i+1) + ": " + camera.percentBlue);
			callback();
    });
  });
});
One that’s all sorted out, I upload the combined estimate to a MySQL database:
pool.getConnection(function(err, connection){
  connection.query('INSERT INTO readings (timestamp, open_chairs) VALUES(?, ?)', [timestamp.format('YYYY-MM-DD HH:mm:ss'), totalEmptySeats], function(err){
    if( err ) throw err;
    connection.release();
  });
});
Full code is here. I’m going to run this script for a few weeks and generate data. Once I get a decently! representative sample, I’ll come back with some visualizations!